As early as 2009-10, researchers were looking at Twitter data mining as a way to predict the incidence of flu. At the time, the H1N1 virus, or “swine flu,” had made the jump from swine to humans and arrived in the United States. The Center for Disease Control (CDC) took notice and began sponsoring research.
Eight years later, data scientists Alessandro Vespignani and his team have developed statistical models for crunching Twitter data in flu forecasting that can predict, six weeks out, when and where a flu outbreak might peak, with 70 to 90 percent accuracy. The Vespignani model integrates flu tweets with CDC data and other inputs of the initial flu conditions, where Twitter acts as “a proxy for monitoring infectious disease incidence.” Vespignani also noted that his model could work with many digital (e.g. social media) sources, which often come with time or location stamps.
Because tweets are unstructured and copious, the chance to make use of Twitter data has inspired advanced work from many sciences – statistical and computational science, behavioral and linguistic science. How do people process language or influence each other? How can we apply machine learning to sort for target data amid random human associations?
Even as the field of ecology becomes buried in data from camera traps, tracking studies, and citizen science records, it has been relatively late in launching its Twitter expedition. But in the September 2018 Methods in Ecology and Evolution, a University of Gloucestershire study by Adam Hart and colleagues looked at the reliability of Twitter data for ecological studies. Hart devised a methodology to collect, scrape, and structure the data sets of tweets about three ecological phenomena.
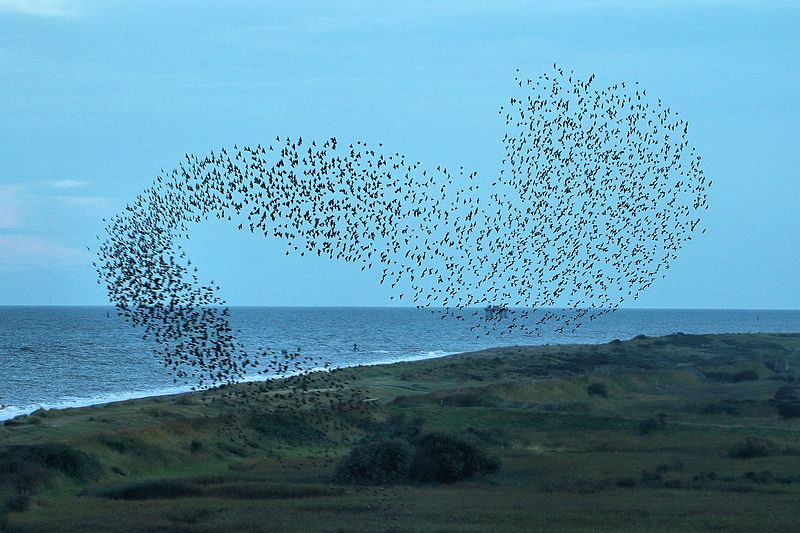
In some sense, they were gambling that these three cyclic ecological phenomena – the annual emergence of flying ants, the sighting of spiders in the home, the synchronized-drone-like murmurations of starlings overhead – might impress Tweeters enough to make a significant appearance on Twitter. And on searching the Twitter API for keywords or hashtags, such as #flyingants, #spider, and #murmurations, the researchers’ gamble paid off.
“Make sure you choose something that people are likely to tweet about,” Hart said. “We still have much to learn about what motivates people to tweet about ecological phenomena and the sorts of information they are motivated to include.”
Hart and his colleagues then compared the Twitter results to published data from three citizen science (CS) studies of the same phenomena over the same time periods. The most robust Twitter samples came from tweets about spider sightings. Twitter-mining yielded fewer data points than the planned (CS) experiments – almost by a factor of ten in some cases – with starling murmurations yielding the fewest. But Hart’s team picked up the slack with data science.
“The statistical approaches we used allow for sample size in
calculating significance,” Hart said. “So [a relatively low number of
data points] is important, but it is allowed for in the analyses.”
Using a statistical comparison method, the Kolmogorov-Smirnov test, to study Twitter’s reliability against the CS data sets, Hart’s team was able to show a striking correlation.
After a discussion of Twitter’s reliability with respect to determining when and where sightings actually occur, the scientists conclude that Twitter mining can be a useful tool for ecologists, particularly in phenology, the study of “nature’s calendar.”
Retrospective data mining of social media and other digital sources
has generated a lot of excitement in ecology because it can shave
considerable time off certain types of big data-focused research
projects.
Gabriella Leighton and colleagues developed a methodology for mining Google Images in tracking where, geographically, members of the same species started to exhibit different color variations. Like Hart et al (2018), Leighton and her co-authors compared Twitter results to known findings (Rounds, 1987) and found substantial correlation. The published paper couldn’t help mentioning time saved:
“Notably, the Google Images method took a few weeks,” Leighton et al reported, “while the more traditional data collection methods undertaken by Rounds (1987) took 3 years.”
A “quick and dirty” research option
From the point of view of Wesley Hochachka, a research associate with Cornell University’s eBird citizen science project, Twitter offers a “quick and dirty” research option.
“You’re not actually getting a sample of reality,” Hochachka told Mongabay, “you’re getting reality filtered through the curiosity of an individual person and their motivation to tell somebody else about it.”
Such individuality brings “noise,” or uncertainty, into the data sets. On a continuum of reliability between “quick and dirty” Twitter mining and long, hard traditional science, Hochachka would put citizen science somewhere in the middle. The eBird app collects data from bird watchers with a wide range of skill levels, at a rate of 7 or 8 million ornithology records a month. So data scientists have a lot to work with as they refine analytical methods to reduce uncertainty.
At the same time, the online eBird form that volunteers use to enter their bird sightings is the product of scientific design and testing. As compared with retrospective Twitter mining, the data form allows for some control – the crux of traditional science – over the data sets coming in.
According to Hochachka, the presence-only bias poses the biggest challenge to Twitter mining.
“You know when an event happened – you know when there’s been a murmuration,” Hochachka said, “but you don’t know when somebody didn’t see that starling murmuration. That’s why these data are never going to be as good as a predesigned study.”
In developing their data entry form, the eBird team sought to
“minimize the proportion of data submitted in a presence-only form.”
Hochachka points to a required field on the form that asks: “’Are you
recording every species that you were able to see and identify?’ And if
they say ‘yes’ – which, about 85 percent of the time, people say – then
we know that if a certain species isn’t on that list, it was not
detected by the observer.”
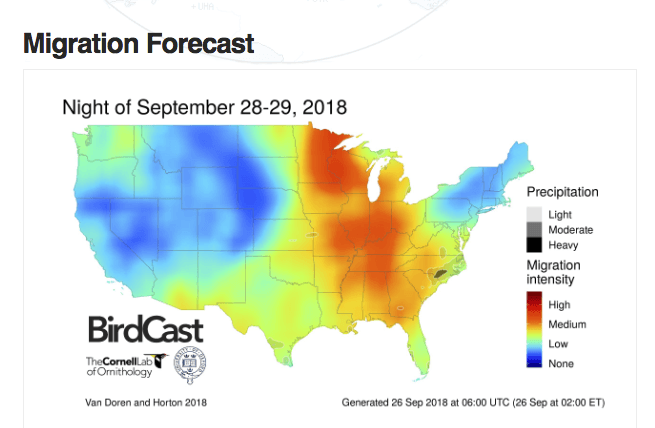
Without this field, the colorful eBird maps describing bird migration patterns would be much less reliable, Hochachka says. The statistical modeling that underlies the maps is predicated on a binary, yes-no analysis, where the absence of yes does not mean no.
“You actually need those nos,” Hochachka said. “If you don’t feed [the nos] into these sorts of analyses, the program itself creates them” (introducing uncertainty).
The bird-watching form tries to minimize other human inconsistencies – amount of time spent bird-watching, distance traveled while watching, the time of year, even the time of day.
“There’s something called a dawn chorus,” Hochachka said. “If you
were to go into the same forest at dawn and at noon, it could be
deafeningly loud at dawn and utterly silent at noon. But the birds
haven’t gone anywhere; they’re just not as detectable.”
A source of big data
As the challenges of big, noisy data attract researchers with specialties in advanced math and computational science, some field scientists worry that hands-on discovery is getting lost in the noise.
Interestingly, Twitter is becoming an apt platform for informal “field work” in ecology. Valuable discoveries arrive on a hashtag or handle, particularly when the tweet contains images. In Hart et al’s Twitter-mined spider study, tweeted images allowed for determining the spiders’ sex and verifying a count of males to females.
Professor Helen Roy from the Centre of Ecology and Hydrology uses Twitter (@UKLadybirds) hand in glove with her online survey of UK ladybirds (“ladybugs” in the US).
“We have been able to improve understanding of insect invasions
through our studies on the harlequin ladybird – a global invasive alien
species,” Roy told Mongabay. Twitter allows Roy to conduct both data
intake and educational outreach.
“Just a few days ago, someone sent a picture [via Twitter] of the
harlequin ladybird eating some moth eggs,” Roy said. “This is an
important example of the way in which the harlequin ladybird may be
adversely affecting other species.” Like retrospective Twitter mining,
this research provides a useful starting point, though it lacks the
representative nature of a statistical sample.
In the end, the findings by Hart et al (2018) offer researchers a different kind of research tool. With its high degree of noise and bias, it will serve less as a substitute for well-designed study and more as a time saver in preliminary research. Hochachka sees it as a potential “snapshot” tool: “if there was no other existing source of information,” Hochachka says, “or if you could gather information, but it would take a long time to collate it, and you wanted a snapshot right now.”
With their broad reach and increasing availability through machine learning analyses, Twitter and other social media may increasingly provide the big data that can help researchers support one avenue of research over another or suggest trends for further investigation.
This story is republished from Mongabay by Marianne Messina under a Creative Commons license. Read the original article.
Citations
Hart, A. G., Carpenter, W. S., Hlustik‐Smith, E., Reed, M., &
Goodenough, A. E. (2018). Testing the potential of Twitter mining
methods for data acquisition: Evaluating novel opportunities for
ecological research in multiple taxa. Methods in Ecology and Evolution.
Leighton, G. R., Hugo, P. S., Roulin, A., & Amar, A. (2016). Just
Google it: assessing the use of Google Images to describe geographical
variation in visible traits of organisms. Methods in Ecology and
Evolution, 7(9), 1060-1070. https://besjournals.onlinelibrary.wiley.com/doi/10.1111/2041-210X.12562
Rounds, R. C. (1987). Distribution and analysis of colourmorphs of the black bear (Ursus americanus). Journal of Biogeography, 521-538.
Share your thoughts and join the technology debate!
Be the first to comment